Introduction
When creating a mosaic, carpet, beadwork, or other color-based artwork, one of the biggest challenges is reproducing a full-color picture using a limited collection of material colors.
You may have hundreds of available tile, bead, yarn, or fiber colors, but not every color in your source picture can necessarily be reproduced with your materials. Even when the available colors cover the picture's overall range, using too many different colors can make production complicated and expensive.
Mosaic Color Analyst helps you understand this problem before production begins.
It analyzes the color range of your available materials and your source picture, compares their color coverage, and helps you build a practical color table using a combination of the picture's outer color boundaries and a reduced set of representative colors.
It is useful for mosaic artists, carpet designers, textile professionals, bead artists, and anyone who needs to reproduce pictures using a limited color collection.
1. Why Does Color Range Matter?
Every material collection has limitations. A collection of colored tiles, for example, may contain many different colors but still lack certain bright, dark, warm, or cool colors found in your source picture.
A basic principle of color mixing helps explain why this matters:
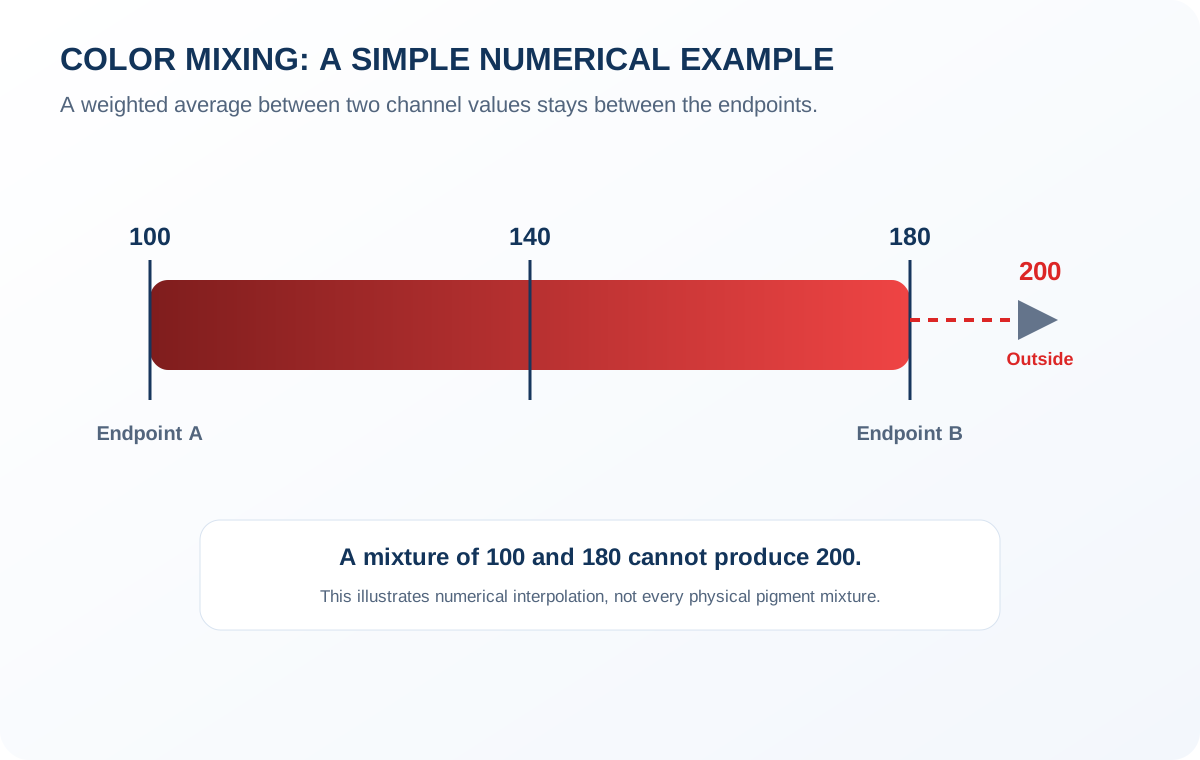
Mixing colors cannot produce a color outside the range of the colors being mixed.
For example, if two colors have red-channel values of 100 and 180, a weighted mixture of them cannot produce a red-channel value of 200. The result remains between the two original values.
This is a simplified explanation using numerical color interpolation. Physical mixing of pigments and materials can behave differently, but the principle helps explain why the available color range is important.
If your material collection cannot reach part of the source picture's color range, some details may be difficult to reproduce accurately.
2. Understanding RGB Color Space
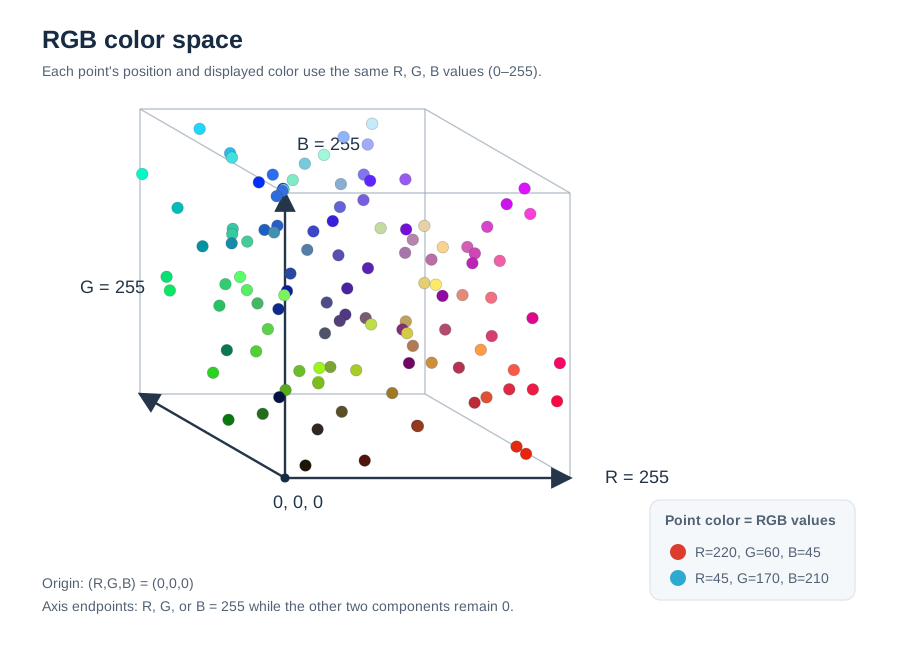
A digital color can be represented by three numerical components:
- Red (R)
- Green (G)
- Blue (B)
Together, these values define a point in a three-dimensional space called RGB color space.
When the colors from a material collection or source picture are plotted in this space, they form a group of points.
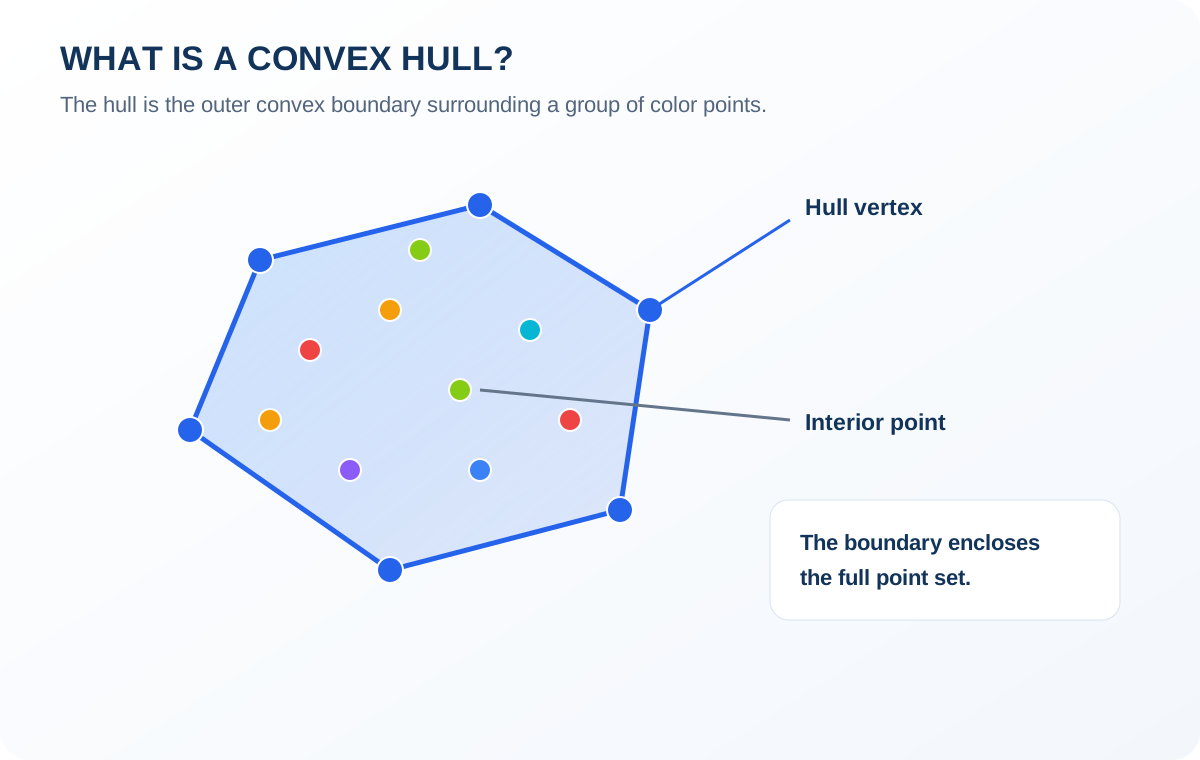
The outer boundary surrounding those points is called a convex hull. It represents the overall color range enclosed by the points.
Mosaic Color Analyst calculates and displays these boundaries so you can compare different color sets visually.
3. Understanding a Convex Hull
A convex hull is the smallest convex boundary that encloses a group of points.
Imagine placing a stretched rubber band around a group of points on a flat surface. The band surrounds the outermost points and forms a boundary. A convex hull is the three-dimensional equivalent of this idea.
In Mosaic Color Analyst, the hull represents the overall color range of a collection of colors.
The colors inside the hull are within the mathematical range enclosed by its vertices.
This gives us a way to compare the color range of a source picture with the range of available materials.
Core concept
4. The Three Color Hulls
The 3D View can display three different convex hulls in the same RGB space. Each one has a different purpose.
4.1 Palette Hull — Your Available Material Colors
The Palette Hull represents the color range of your selected material library, such as a tile collection or yarn color chart.
It tells you the overall color range available from your existing materials.
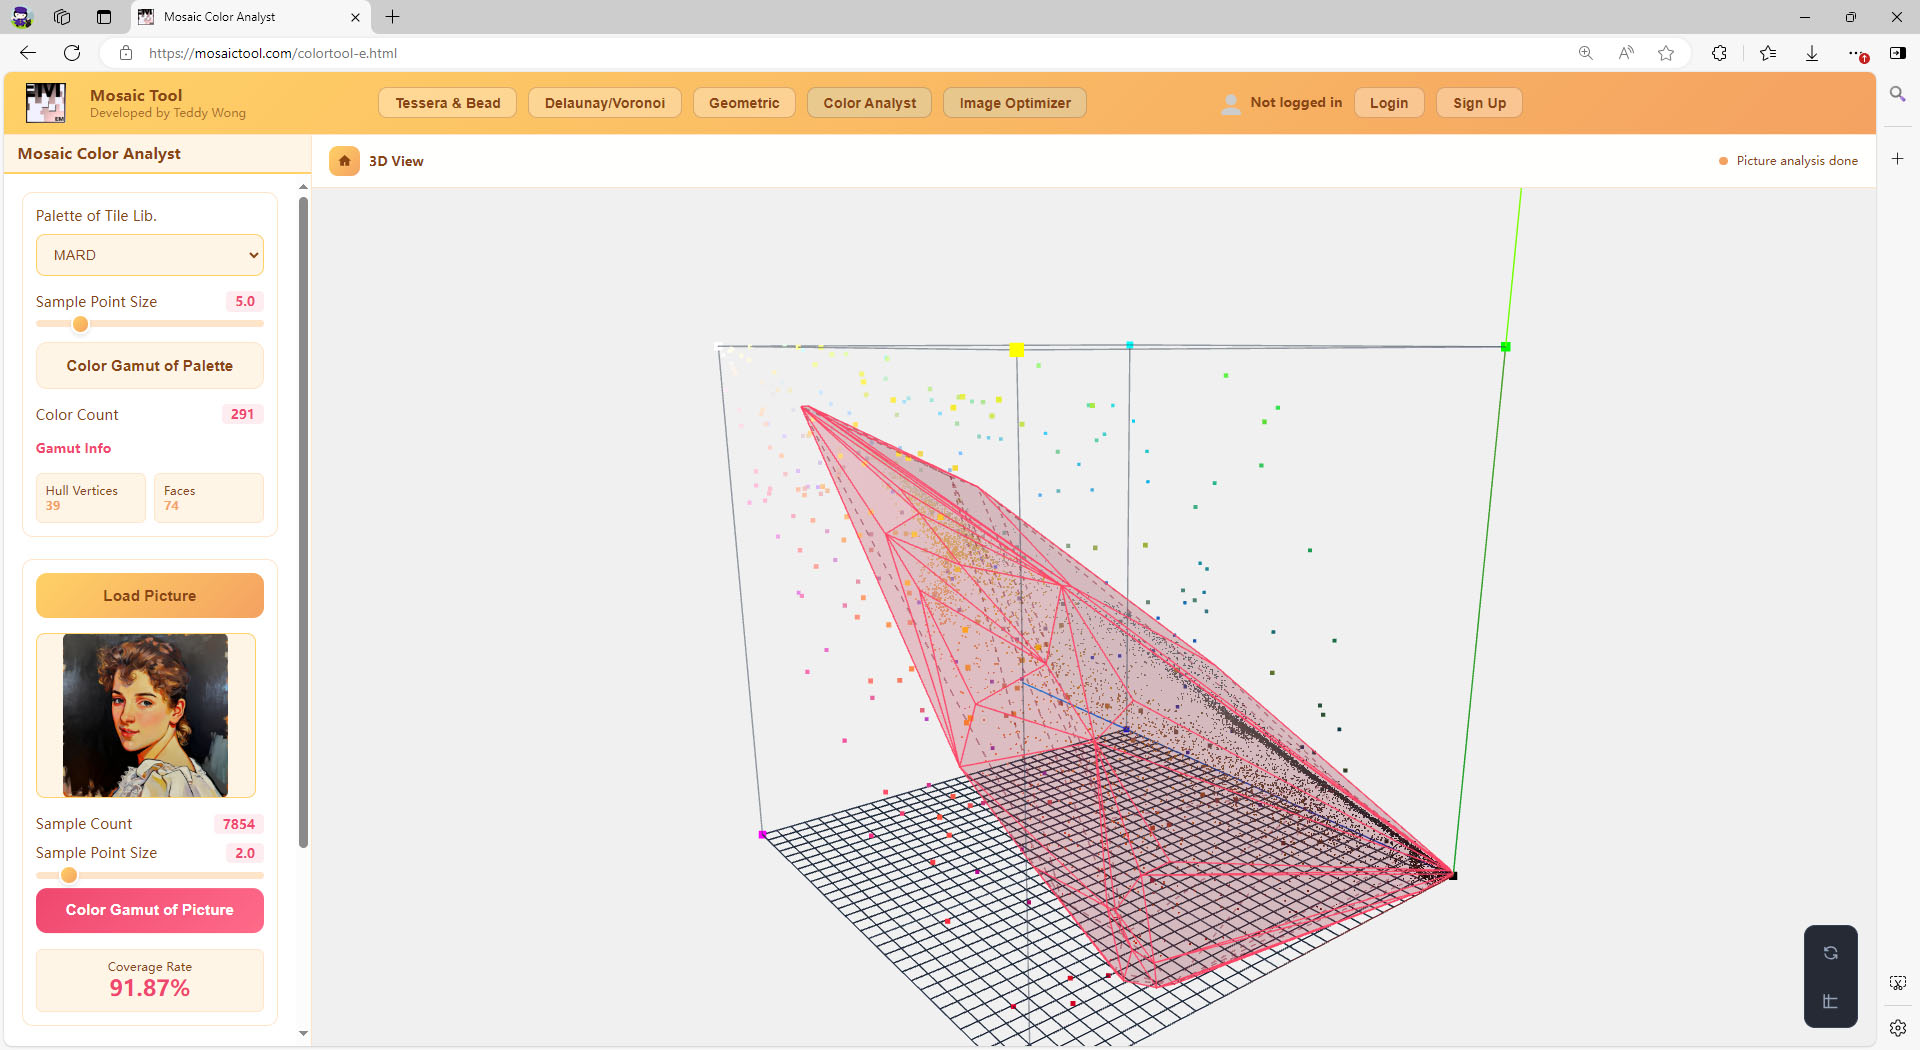
4.2 Picture Hull — The Full Color Range of Your Source Picture
The Picture Hull is calculated from the sampled colors of your loaded picture.
Its vertices define the outer color boundaries of the original picture. These extreme colors are important because they represent the limits of the picture's color range.
Preserving these boundary colors helps prevent important color extremes from disappearing when you simplify the picture.
4.3 Quantized Hull — The Simplified Color Range
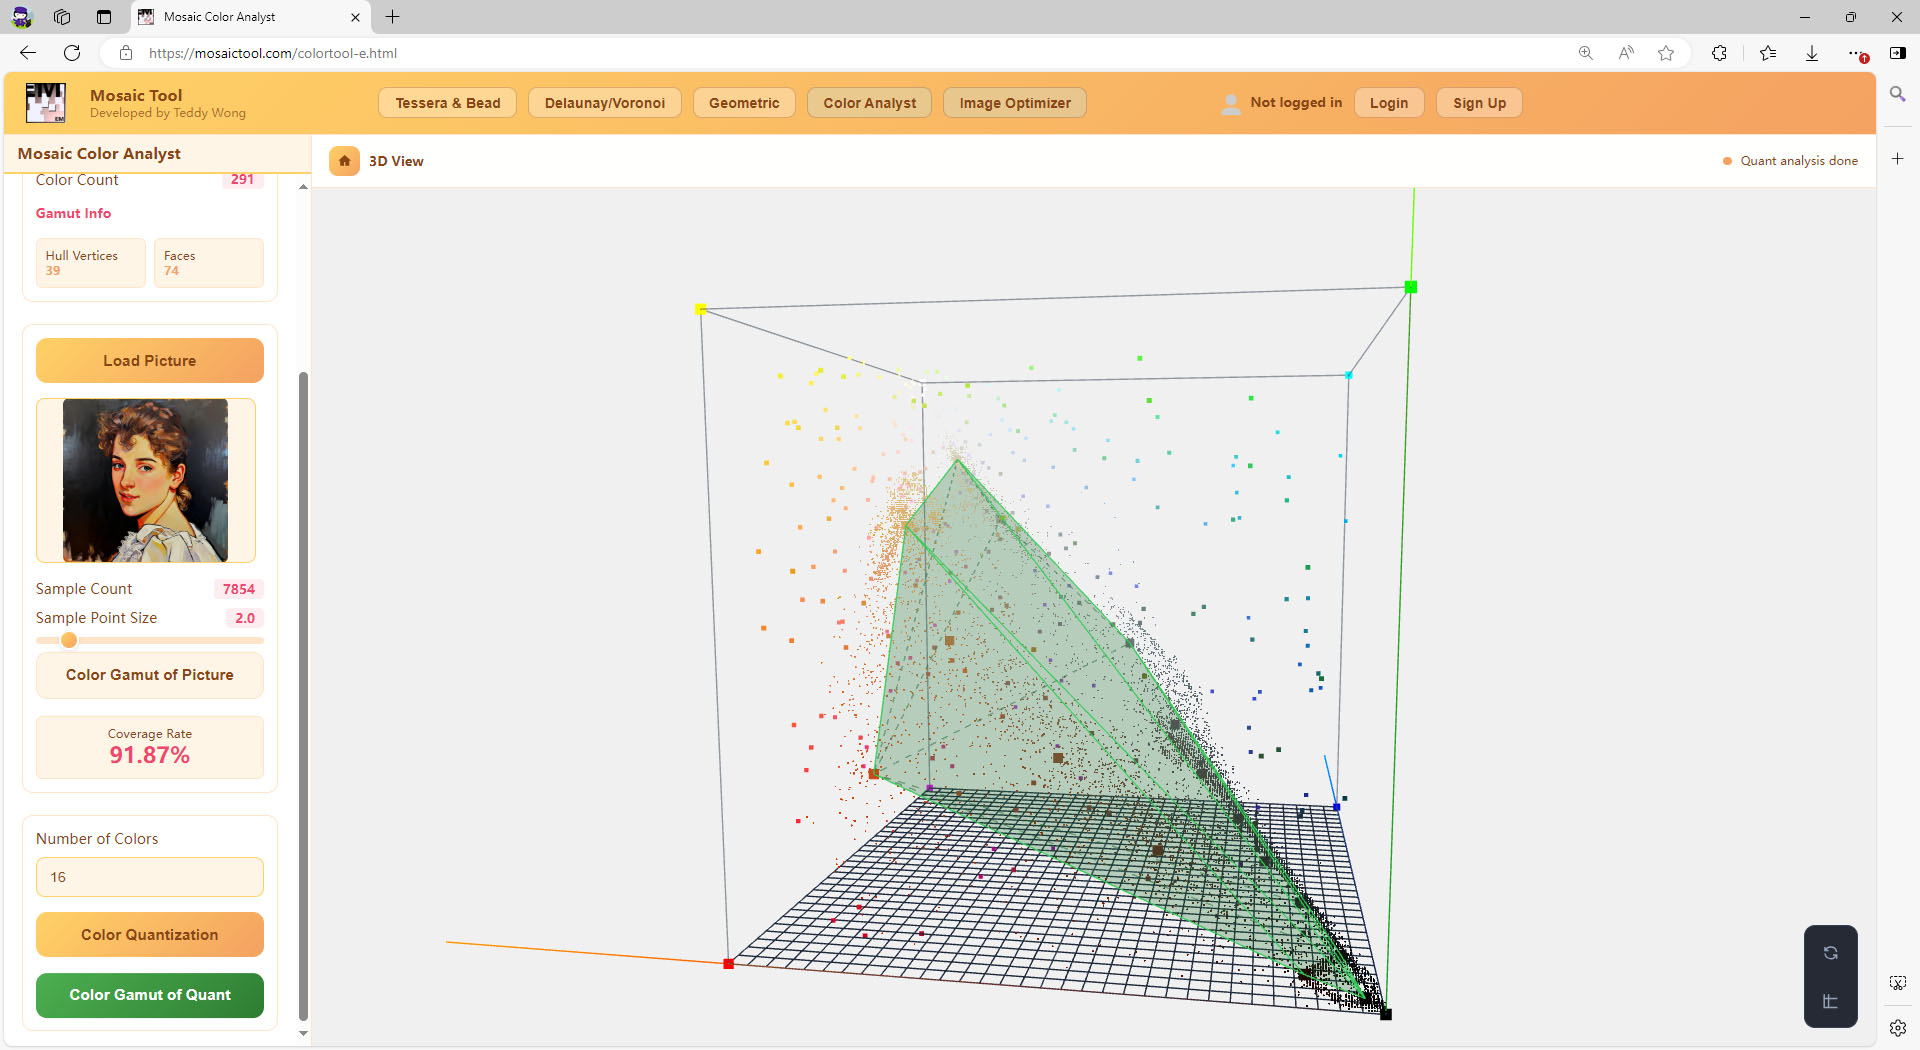
The Quantized Hull is calculated from the reduced set of representative colors produced by Color Quantization.
Because quantization reduces the number of colors, its hull is generally smaller than the original Picture Hull.
The quantized colors are derived from the original picture's color distribution. They represent its main colors using a more manageable number of color samples.
4.4 Comparing All Three Hulls
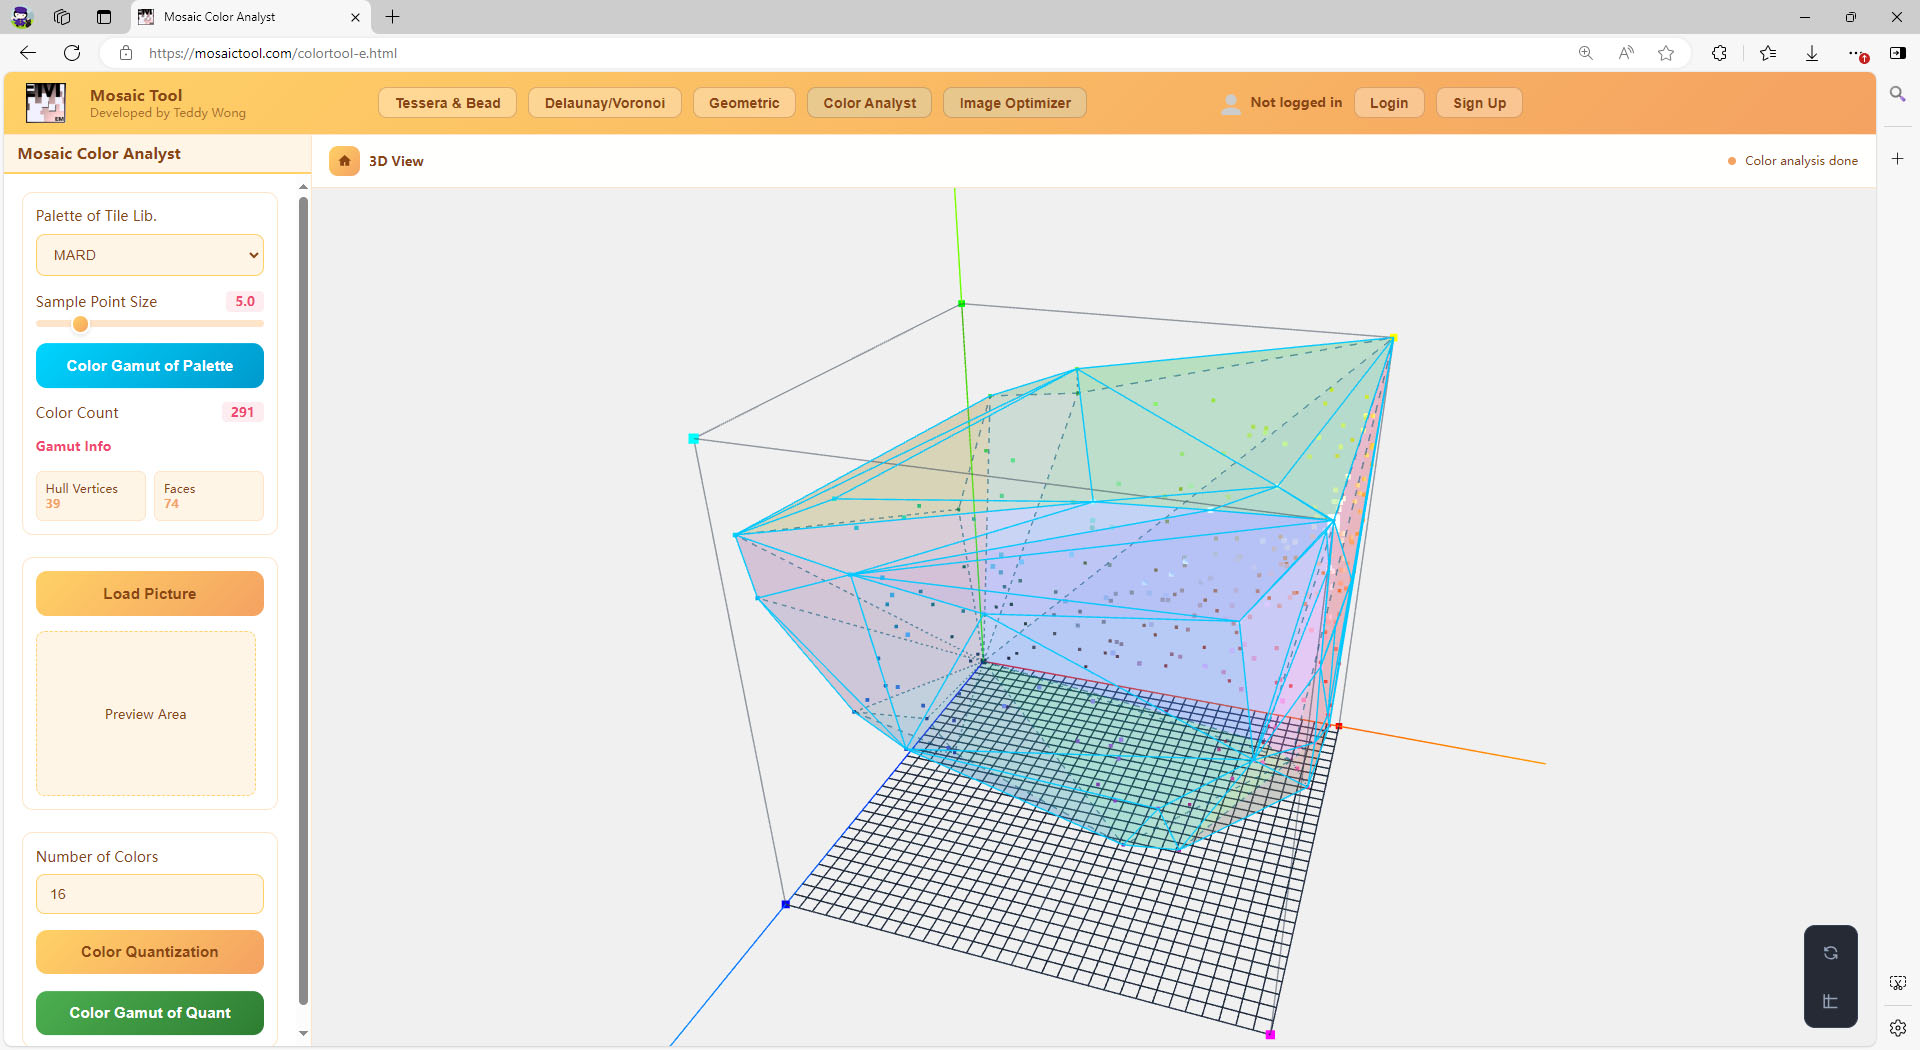
The most useful way to understand the relationship is to display all three hulls together. All three hulls occupy the same 3D RGB coordinate space, allowing you to understand their relative positions and sizes.
| Hull | What it represents |
|---|---|
| Palette Hull | The color range of your available materials |
| Picture Hull | The full color range of your original picture |
| Quantized Hull | The reduced color range after quantization |
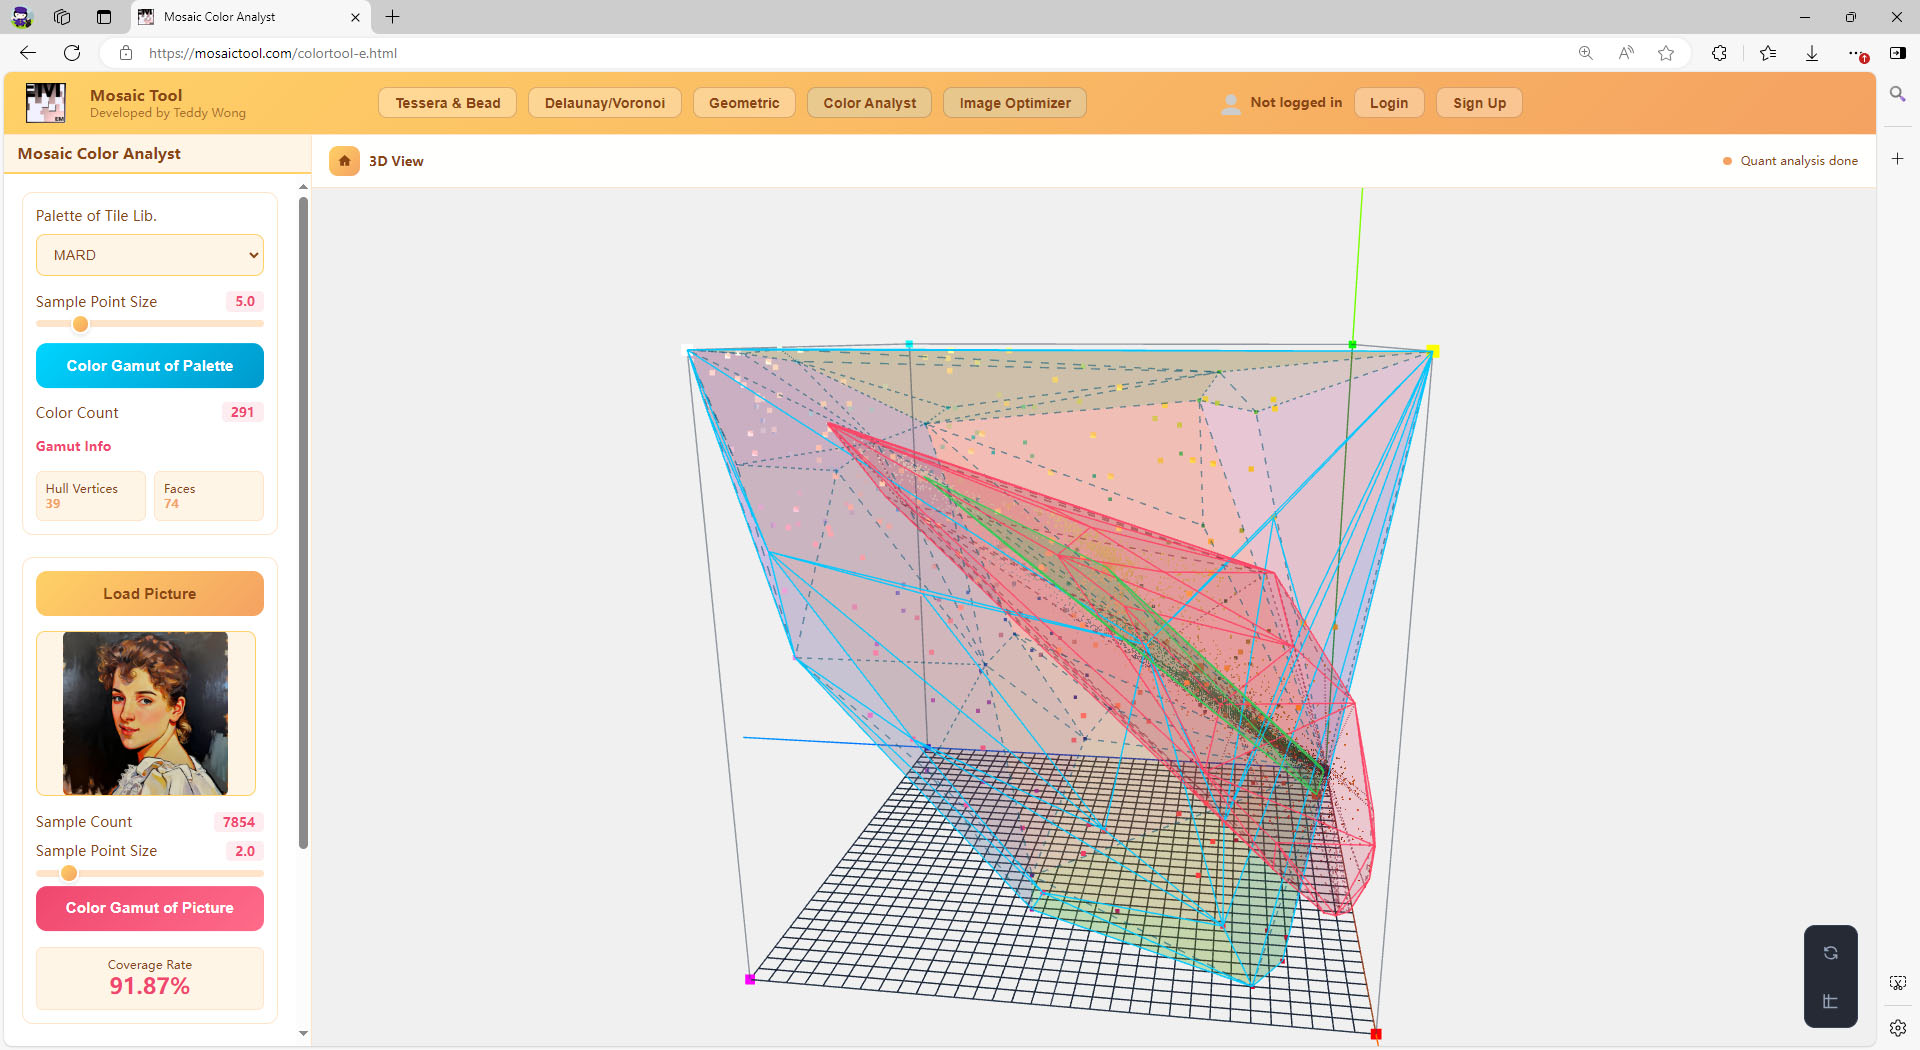
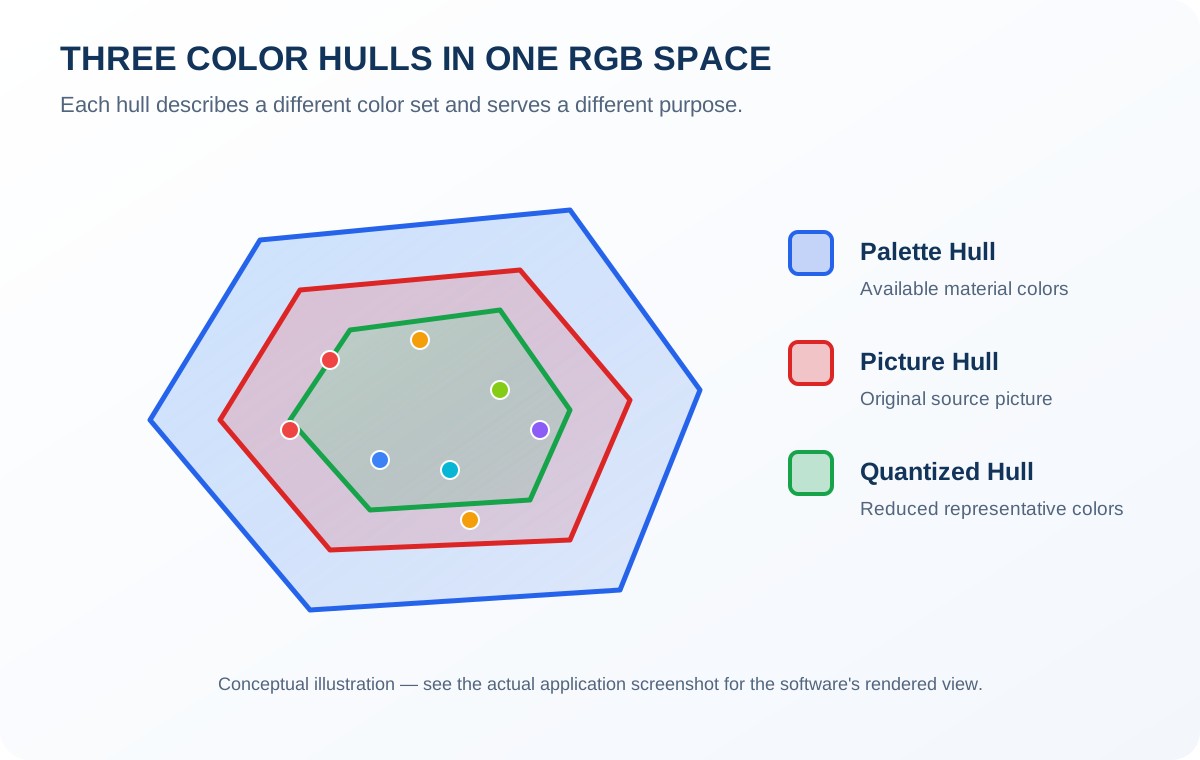
The conceptual diagram summarizes the idea: each hull describes a different color set, drawn together in one shared RGB space.
The real screenshot above it shows the same relationship as rendered by the software. Use the conceptual view to learn the vocabulary; use the 3D View in the application to inspect your own materials and pictures.
5. Understanding Coverage Rate
The Coverage Rate measures how many of the sampled colors in the source picture are covered by the Palette Hull.
The tool compares the sampled picture colors with the convex hull of your selected material palette.
A higher Coverage Rate means that more of the sampled picture colors fall inside the available palette's color range. A lower Coverage Rate indicates that more sampled picture colors fall outside that range.
This is an important pre-production check. It helps you identify whether your current material collection is suitable for reproducing the source picture.
Remember that Coverage Rate measures color-range coverage. It is not a direct measurement of final visual similarity or production quality.
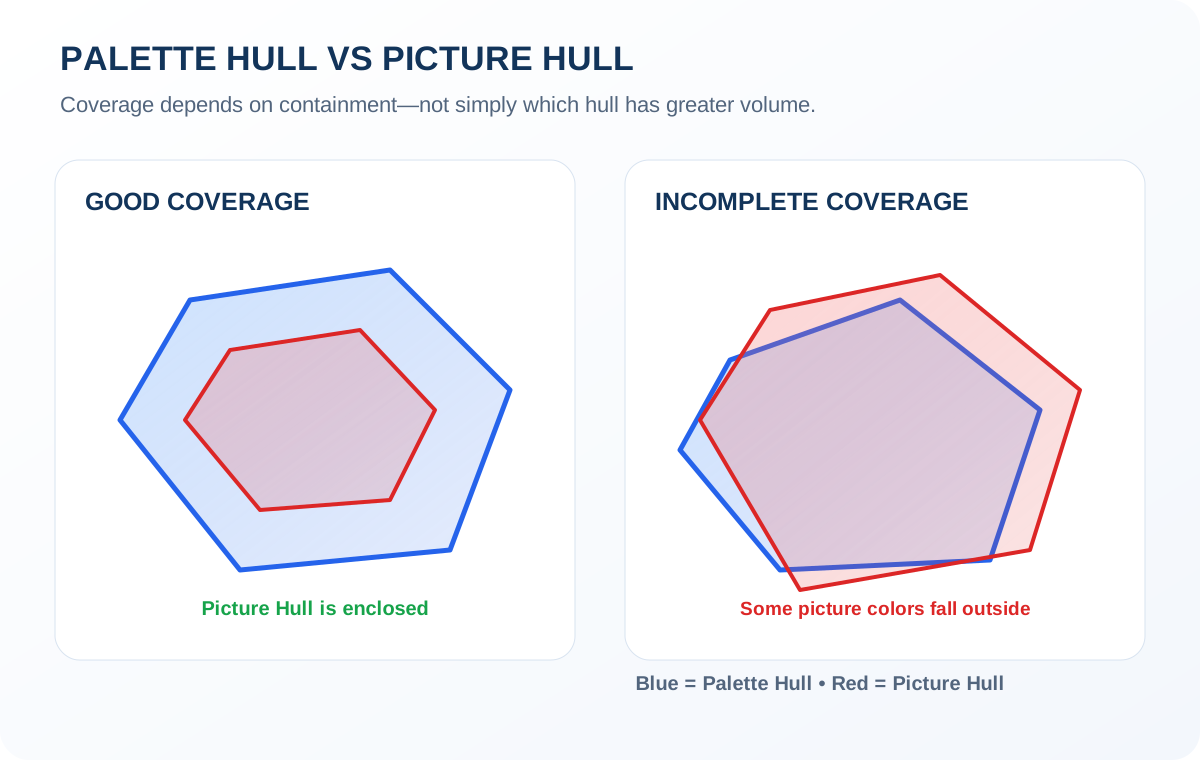
Do not confuse hull volume with coverage. The important condition is containment: whether the Picture Hull is enclosed by the Palette Hull — not simply whether one hull has a larger volume than the other.
6. Color Quantization — Fewer Colors, Simpler Production
A source picture may contain thousands or millions of different RGB values. Using too many colors in a physical project can make material management and production unnecessarily complicated.
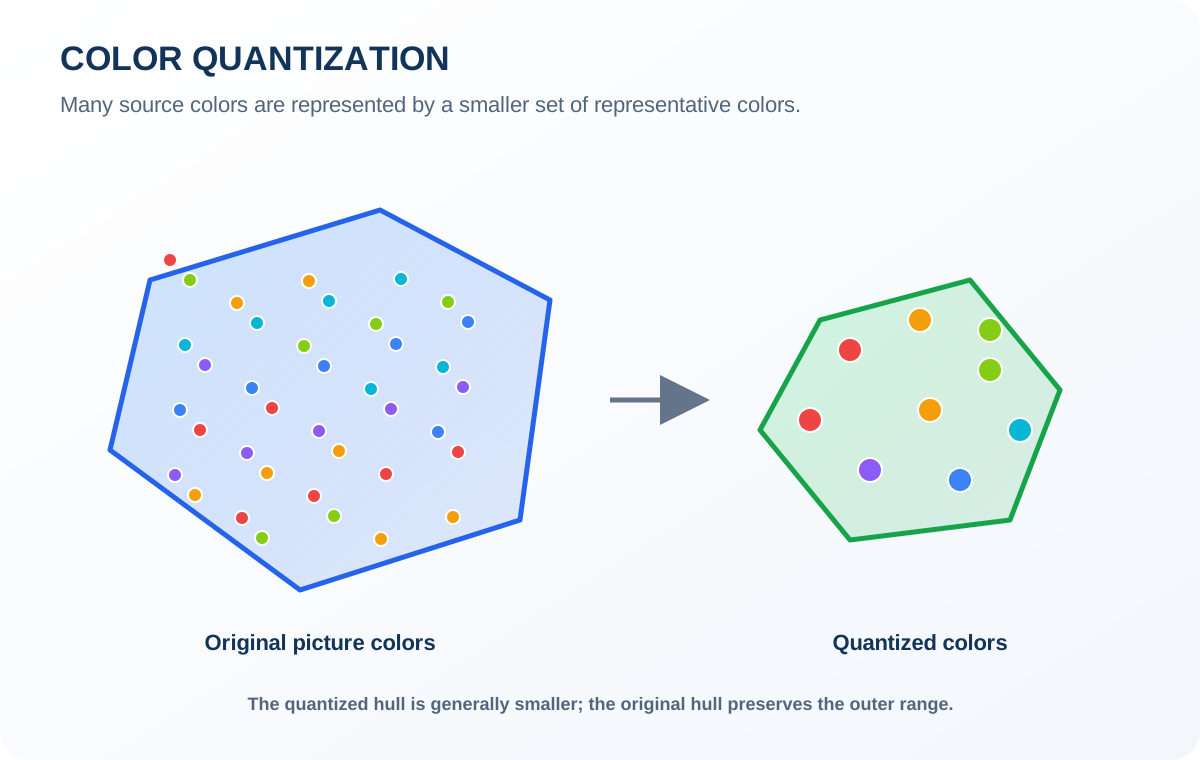
Color Quantization reduces the number of colors in the loaded source picture. You choose a target number of colors, and the tool generates a smaller set of representative colors using a color-reduction algorithm, such as K-means or other clustering methods.
For example, you might want to simplify a picture to 30 representative colors instead of working with hundreds of different colors. The goal is to find a practical balance:
- Retain the picture's important visual characteristics.
- Reduce the number of colors needed for production.
- Make the resulting color table easier to manage.
Why Is the Quantized Hull Smaller?
Quantization groups similar colors and represents them with fewer colors.
The representative colors are derived from the original picture's color data. For averaging-based clustering methods, these representative colors remain within the original picture's convex hull.
The resulting hull is therefore generally smaller than the original Picture Hull, although the exact shape depends on the picture and the selected number of colors.
This is useful for simplifying the color distribution, but it also means that some extreme colors may no longer appear in the quantized result.
The key idea
7. The Recommended Method: Combine Picture Hull Vertices and Quantized Colors
This is the key idea behind building a practical new color table.
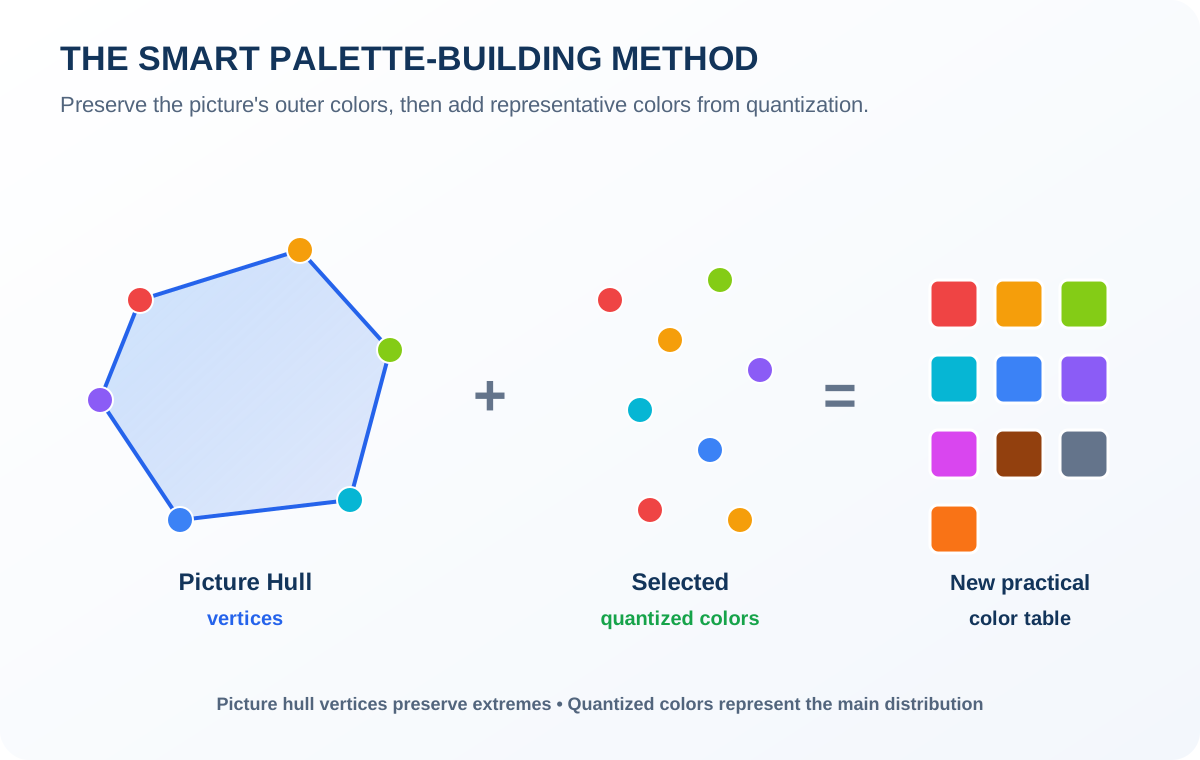
Using only the quantized colors may lose some of the original picture's extreme colors. Using only the Picture Hull vertices preserves the outer color range, but those vertices alone are usually not enough to represent the picture's full color distribution and visual details.
Picture Hull Vertices + A Reasonable Selection of Quantized Colors = A Better Practical Color Table
These two groups serve different purposes — and combining them balances color-range preservation with practical production requirements.
Picture Hull Vertices Preserve the Extremes
They retain the outer boundaries of the original picture's color range, helping to preserve important bright, dark, and distinctive colors.
Quantized Colors Preserve the Main Color Distribution
They provide representative colors from the picture's main visual areas without requiring an unnecessarily large color table.
The Result: A Better Practical Color Table
Combining the two creates a better starting point for a new palette: the original picture's outer color range is retained, while the main colors are represented by a manageable selection of samples. The result is a practical color table that balances color coverage and production complexity.
8. How to Use Mosaic Color Analyst
-
Step 1 — Select Your Material Library
In Palette of Tile Lib., select the material color library you want to analyze. The tool reads the available colors and displays their color information.
-
Step 2 — Calculate the Palette Hull
Click Color Gamut of Palette. The tool calculates the convex hull of the selected material colors. The Gamut Info area displays information about the hull, including its number of vertices and faces.
-
Step 3 — Load Your Source Picture
Click Load Picture and select the image you want to reproduce. The picture will appear in the Preview Area, and its colors will be sampled for analysis.
-
Step 4 — Calculate the Picture Hull
Click Color Gamut of Picture. The tool calculates the convex hull of the sampled picture colors. You can now compare the Picture Hull with the Palette Hull in the 3D View.
-
Step 5 — Check the Coverage Rate
Review the Coverage Rate to understand how much of the sampled picture color data is covered by your selected material palette. This helps you decide whether your existing materials are suitable or whether you should consider adjusting the source picture or choosing another material collection.
-
Step 6 — Choose the Number of Colors
Enter your desired number of representative colors in Number of Colors. Choose a number that balances the visual quality you need with the complexity you can manage during production.
-
Step 7 — Run Color Quantization
Click Color Quantization to generate a simplified color set from the loaded source picture. Then click Color Gamut of Quant to calculate and display the Quantized Hull.
-
Step 8 — Compare All Three Hulls
Use the 3D View to inspect the Palette Hull, Picture Hull, and Quantized Hull together. Pay particular attention to the difference between the original picture's outer boundary and the smaller quantized color range.
-
Step 9 — Build Your New Color Table
Use the Picture Hull vertices together with a reasonable selection of quantized colors. This combination preserves the original picture's outer color boundaries while retaining representative colors from its main color distribution. Review the resulting color table before using it in your production workflow.
Note about Sample Point Size: Sample Point Size is automatically adjusted and intended for debugging and visualization purposes. Ordinary users do not need to change it.
9. Improving Your Source Picture
Color analysis can also help you decide whether your source picture should be adjusted before production.
If some of its colors fall outside your material palette's range, you may consider:
- Adjusting brightness and contrast.
- Changing saturation or color balance.
- Modifying areas whose colors cannot be represented by your materials.
- Choosing another source picture that better matches your available colors.
The goal is not necessarily to reproduce every original pixel exactly. It is to obtain the best practical result within the limits of your materials and production process.
10. Who Can Benefit from This Tool?
Mosaic Color Analyst is designed for people who reproduce pictures using a limited collection of physical colors. Typical applications include:
-
Mosaic artists
Check whether a tile collection can cover the colors in a reference picture.
-
Carpet designers
Analyze a design against a fixed yarn or fiber color chart.
-
Bead artists
Build manageable color palettes for complex beadwork.
-
Textile professionals
Evaluate color limitations before manufacturing.
-
Other color-based crafts
Prepare practical palettes from large source pictures.
Conclusion
A good color-limited design starts with understanding the relationship between the source picture and the available materials.
Mosaic Color Analyst brings together RGB color-space visualization, convex hull analysis, Coverage Rate, and Color Quantization to help you make better color decisions.
Its most useful palette-building principle is simple:
Preserve the original picture's outer color boundaries, then combine them with a practical selection of representative quantized colors.
This gives you a more balanced starting point for creating artwork with fewer materials, without unnecessarily sacrificing the original picture's color range.